GTM / Marketing Finance
Marketing Investment Economics
Evaluating acquisition efficiency, contribution payback, and capital-allocation risk
Self-directed portfolio project using synthetic data. Evaluated channel acquisition efficiency, contribution-margin payback, and downside sensitivity to identify where incremental marketing tests deserve attention.
View PDF View GitHub Back to selected work
Business Question
How should Finance evaluate where to test incremental marketing investment when channel acquisition costs, attributed returns, and modeled customer economics differ?
Context / Data
The published fixture includes spend, an attributed new-customer proxy, platform conversions / purchases, platform-attributed conversion value, blended CAC, and platform-attributed ROAS. Portfolio fixture spend is $3,146,410.26 across 64,017 attributed new customers.
| Channel | Spend | Share of spend | Attributed new cust. proxy | Blended CAC | Platform-attributed ROAS |
|---|---|---|---|---|---|
| Meta Ads | $2,836,272.12 | 90.1% | 59,402 | $47.75 | 2.40x |
| Google Ads - Search | $251,539.45 | 8.0% | 3,180 | $79.10 | 2.94x |
| Google Ads - YouTube | $58,598.69 | 1.9% | 1,435 | $40.84 | 5.63x |
Synthetic ad fixtures. Platform-attributed ROAS is not profit and is not incremental return. These metrics identify differences in average acquisition efficiency, not marginal return on the next dollar.
Approach
Observed acquisition metrics are compared with modeled contribution economics. Lifetime figures are forward modeled over 38 months. They are not realized historical cohort performance. Retention and ARPU are shared assumptions ($50 / month, flat; shared retention curve from 1.00 to 0.01). Channel differences in modeled contribution also reflect finance-driver assumptions for gross margin, refunds, fees, and variable cost.
Downside cases recompute the contribution waterfall. They do not apply cosmetic percentages to the ratio. There is no marginal-response curve in this fixture, so a “move spend and keep the same return” scenario is not valid.
Key Findings
YouTube has the lowest blended CAC ($40.84); Search has the highest ($79.10). Meta is 90.1% of spend.
| Channel | Modeled lifetime CM / customer | Weighted CM / CAC | Modeled payback month | Cohorts not paying back |
|---|---|---|---|---|
| YouTube | $133.41 | 3.267x | 2 | 2 / 36 |
| Meta | $118.50 | 2.482x | 4 | 4 / 52 |
| Search | $113.59 | 1.436x | 13 | 12 / 35 |
Search has the thinnest modeled cushion. Under ARPU −20%, weighted CM/CAC falls to 1.05x with payback month 29. CAC +20% leaves Search at 1.20x. YouTube remains above 2.45x even with ARPU −20%, but is only 1.9% of fixture spend. Meta stays above 1.83x in that case while already representing 90.1% of spend.
Financial / Business Implications
Average economics identify test priorities, not automatic budget shifts. Search has the least downside cushion in the modeled economics. YouTube warrants incremental testing because baseline modeled economics are strongest — not because scale is proven. Meta warrants continued scrutiny because it is already 90.1% of fixture spend. Assumption sensitivity materially changes investment attractiveness, especially for Search.
Before scaling, Finance still needs marginal CAC and spend capacity / saturation; incremental contribution, not only platform-attributed ROAS; attribution overlap and cannibalization; and realized retention, ARPU, and customer quality by channel.
Recommendation
- Set channel investment guardrails using contribution-margin payback and downside cases, not ROAS alone.
- Prioritize incremental testing where average modeled economics are strongest, while explicitly testing marginal CAC and capacity.
- Investigate Search cohorts that do not pay back within the 38-month modeled horizon before adding spend.
- Replace shared ARPU/retention assumptions with observed channel and customer-quality data when enough history exists.
Selected Visual
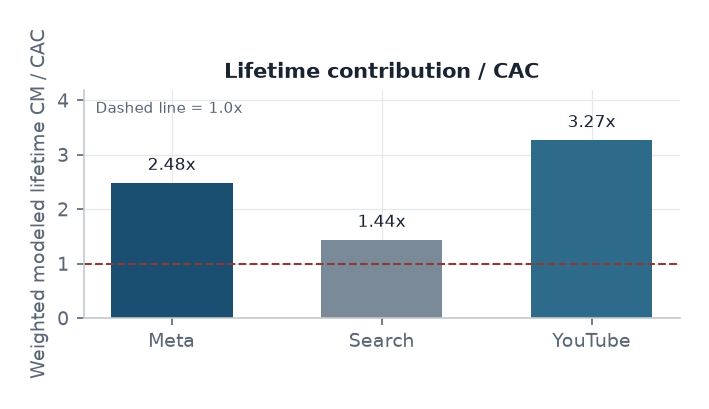
Channel snapshots, contribution comparisons, and downside cases are in the Marketing Investment Economics PDF.
Technical Methodology
Tools used: Python, DuckDB, SQL, pandas, and matplotlib. Limitations stated in the PDF include synthetic ad fixtures; sparse sampled dates rather than a continuous daily panel; platform attribution that is not causal incrementality; modeled ARPU and retention; a 38-month forward horizon; fixture-limited Google campaign taxonomy; and no marginal-response or saturation data.
GitHub Repository
Methodology and code: github.com/ecastillo081/Marketing-Finance-Dashboard.