Revenue forecasting
Merchant Revenue Forecasting
Choosing a governable default for 12-month merchant-level planning
Finance teams forecasting heterogeneous merchant portfolios face a practical tradeoff: one standard method is easier to govern, but individual merchants may behave differently. Using a synthetic portfolio of 50 merchants, I evaluated forecasting methods to identify a defensible default for annual planning and a framework for managing merchant-level exceptions.
View PDF View GitHub Back to selected work
Business Problem
Finance needs a repeatable way to forecast revenue across merchants with different growth, seasonality, and volatility patterns. Selecting the most sophisticated model by default can add complexity without improving forecast quality. The objective was to determine which method should anchor the planning forecast and how Finance should identify merchants requiring separate treatment.
Data and Evaluation
The dataset contains 3,000 synthetic merchant-month observations: 50 merchants across January 2020–December 2024. The primary evaluation uses 48 months of training history and a common 12-month holdout covering 2024.
Rolling-origin checks repeat the same 12-month horizon from earlier year-ends: forecast 2022 using data through December 2021, 2023 using data through December 2022, and 2024 using data through December 2023.
Models were compared using the unweighted mean of merchant-level MAPE as the primary ranking measure, with MAE, RMSE, sMAPE, MASE, and the distribution of merchant-level errors used as supporting checks. The data are entirely synthetic and do not represent an employer or customer portfolio.
Headline MAPE is an unweighted mean across merchants, not portfolio-dollar forecast error. No production deployment or realized business savings is claimed.
Approach
I established Seasonal Naive as the planning baseline, benchmarked alternative forecasting methods on the same horizon, and compared both average error and merchant-level variability. This separated the portfolio-level recommendation from the question of whether individual merchants might require a different method.
The methods were Naive, Seasonal Naive, SMA(3), WMA(1,2,3), SES, Holt, Holt-Winters, SARIMA, and Driver Scenario Regression. The driver-based forecast used planning assumptions available at the forecast origin rather than realized holdout-period outcomes.
Key Result
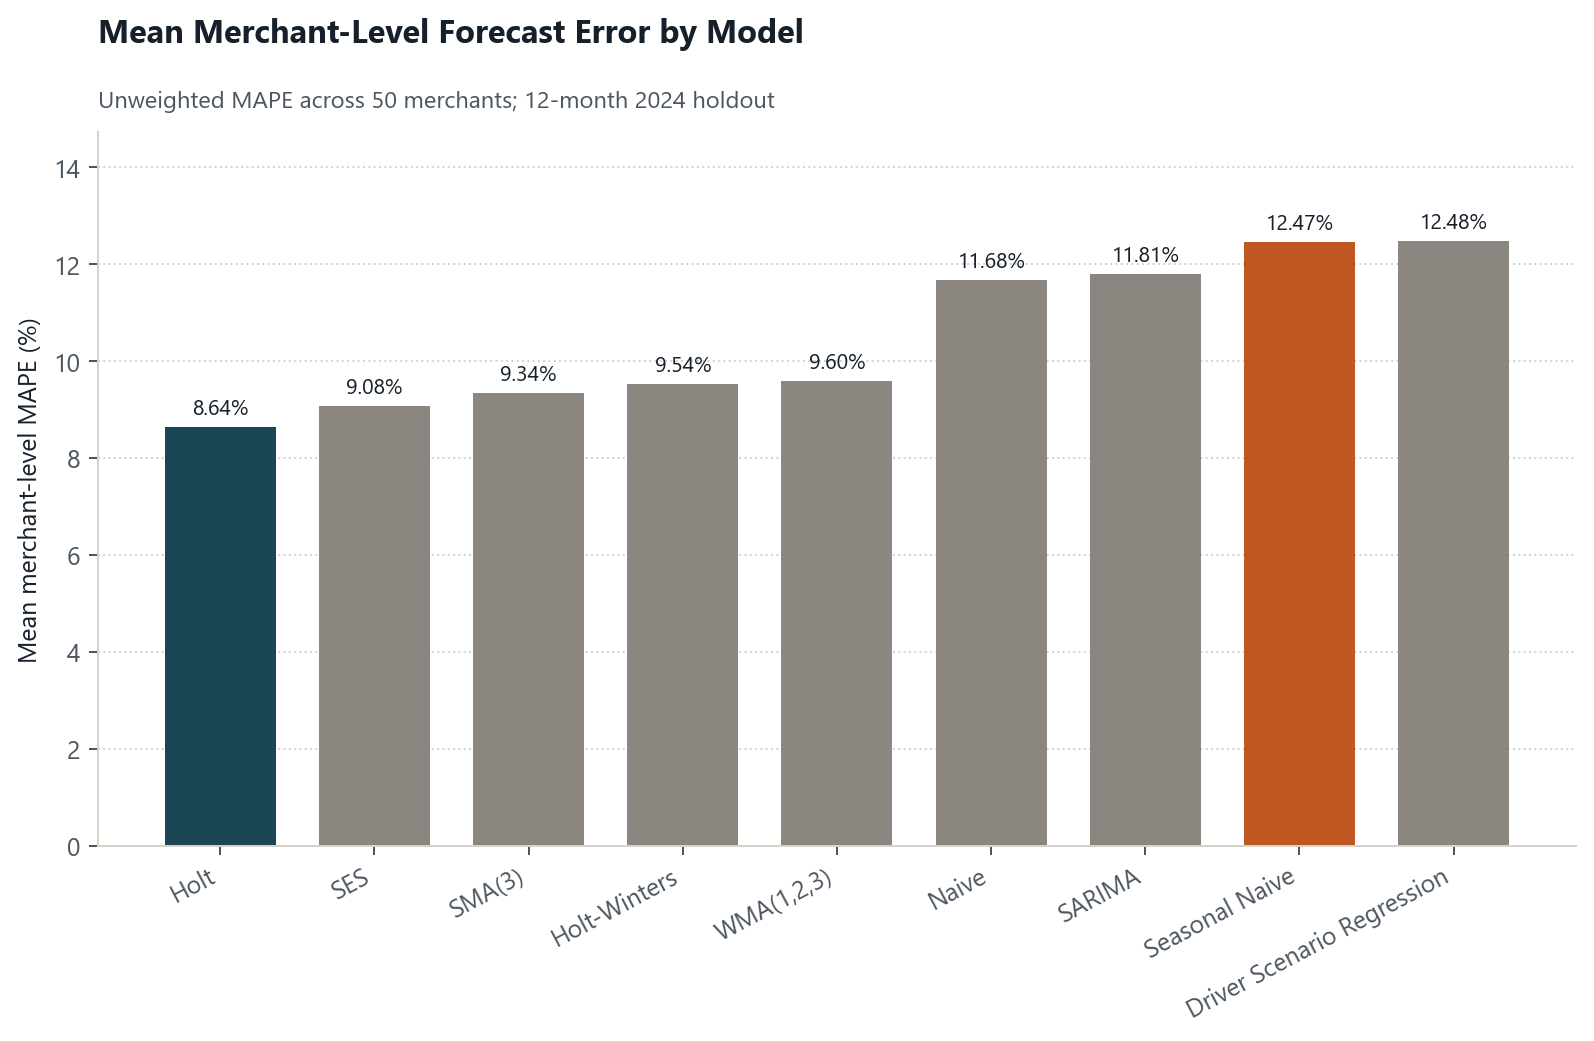
Holt achieved the lowest mean merchant-level MAPE at 8.64%, compared with 12.47% for Seasonal Naive. That represents a 3.83 percentage-point improvement, or a 30.7% relative reduction in forecast error.
The comparison also showed that additional model complexity did not automatically improve accuracy: after origin-safe assumptions replaced leaked holdout drivers, Driver Scenario Regression had a 12.48% mean MAPE and SARIMA 11.81%, while simpler smoothing methods occupied the strongest 2024 positions. Holt was best for 17 of 50 merchants (34%).
| Model | Mean MAPE | Best-model count |
|---|---|---|
| Holt | 8.64% | 17 (34%) |
| SES | 9.08% | 7 (14%) |
| SMA(3) | 9.34% | 5 (10%) |
| Holt-Winters | 9.54% | 8 (16%) |
| WMA(1,2,3) | 9.60% | 4 (8%) |
| Naive | 11.68% | 3 (6%) |
| SARIMA | 11.81% | 3 (6%) |
| Seasonal Naive | 12.47% | 1 (2%) |
| Driver Scenario Regression | 12.48% | 2 (4%) |
Rolling-origin results do not support treating Holt as a time-robust default. Among methods eligible in every window, SES had the lowest average error across 2022–2024 (9.75%), ahead of SMA(3) (9.84%) and Holt (9.88%). Holt won 2023 and 2024 but deteriorated in the 2022 origin.
Planning Recommendation
Adopt a champion/challenger policy rather than forcing one method onto every merchant or every year. Treat Holt as the 2024 champion, retain Seasonal Naive as the minimum-performance benchmark, and keep SES and SMA(3) as challengers because they were stronger or more stable across rolling windows.
Review merchant-level backtests and permit an override only when another model produces consistently lower error across multiple forecast windows. Finance should also maintain a high-uncertainty merchant watchlist for businesses with persistently elevated or volatile forecast error. Those merchants should receive wider planning ranges, additional business-partner input, and explicit upside/downside scenarios.
Finance-leader takeaway
Takeaway for finance leaders: The best forecasting process is not necessarily the most technically complex. A transparent default model, an objective baseline, and disciplined exception monitoring can provide a more governable planning process than selecting models by sophistication alone.
Selected Visual
Merchant-level error distributions and a representative merchant path (M048, whose Holt MAPE is closest to the portfolio median) are in the Merchant Revenue Forecasting PDF.
Limitations
- The dataset is synthetic and does not represent an employer or customer portfolio.
- Results may not generalize to real merchant businesses.
- The primary MAPE is an unweighted mean across merchants and should not be interpreted as portfolio-dollar forecast error.
- The work does not claim production deployment or realized business savings.
- Driver forecasts depend on planning assumptions available at the forecast origin.
- Rankings may change as new actuals arrive and should be confirmed through rolling-origin backtesting.
- SARIMA and Driver Scenario Regression were not eligible for the 2022 window because they require longer training history.
Technical Methodology
Tools used: Python, pandas, statsmodels, scikit-learn, and matplotlib. Forecasts are origin-safe: holdout actuals and holdout actual drivers are used only for scoring. Automated leakage tests live in the GitHub repository. The analysis does not claim causal interpretation of drivers or interventions.
GitHub Repository
Methodology, committed result files, and code: github.com/ecastillo081/Merchant_Revenue_Forecasting.