SaaS economics
SaaS Growth Economics
Diagnosing recurring-revenue growth, retention, and acquisition efficiency
Self-directed portfolio case using synthetic subscription data. Analysis of ARR and MRR growth, ARR bridge, retention, NRR, GRR, churn, CAC, LTV, payback, cohort behavior, contribution economics, and management reporting.
View PDF View GitHub Back to selected work
Business Question
How should Finance evaluate whether recurring-revenue growth is durable when ARR, retention, customer mix, and acquisition activity are moving in different directions?
Context / Data
The fixture covers April 2024 through September 2025, with an as-of date of 2025-09-30. It includes 100 synthetic logos. ARR is stated on a run-rate basis (MRR × 12).
This is a self-directed portfolio project using synthetic data. It does not describe a real company, and it is not a production deployment.
Approach
The analysis separates the growth story into beginning-base retention, new-logo acquisition, reactivation, and expansion rather than treating ARR movement as a single rate. Retention is reviewed with NRR and GRR. Acquisition efficiency is reviewed with assigned customer CAC payback using monthly contribution margin: CAC ÷ (ARPU × 80% gross margin).
Key Findings
Run-rate ARR peaked at $73,560 in July 2025, then declined approximately 19% to $59,400 by September 2025. There was no true expansion engine in this fixture.
From April through September 2025, $32.9k of new ARR was offset by $32.9k of churn ARR. $5.0k of reactivation was the only net bridge contribution. Growth depended on new-logo acquisition, with reactivation providing a smaller offset.
NRR and GRR are identical in this fixture because there were no true upgrades and no contractions. Mean NRR / GRR was 95.5%. August 2025 NRR was 82.9%. No month had NRR above 100%. Active customers rose to 73 by September 2025 even as ARR fell from the July peak.
Corrected CAC payback averaged 11.1 months. Blended ARPU fell from $93.1 in May 2025 to $67.8 in September 2025, reducing contribution dollars available to recover CAC.
| Channel | New logos | Avg assigned CAC | Sep ARPU | Payback proxy |
|---|---|---|---|---|
| Paid | 39 | $931 | $61 | 19.2 mo |
| Organic | 31 | $213 | $94 | 2.8 mo |
| Partner | 20 | $732 | $58 | 15.9 mo |
| Outbound | 10 | $560 | $37 | 18.8 mo |
Financial / Business Implications
Headline ARR growth through mid-2025 masked a missing expansion engine. Mean NRR of 95.5% means the existing base shrinks unless new logos or reactivation replace leakage. Falling ARPU lengthens effective payback even when monthly CAC is not rising. Paid acquisition is the largest logo source and has the highest payback proxy in this mix.
Recommendation
These are analytical recommendations for how Finance should review the book, not actions that were implemented.
- Separate the forecast into beginning-base retention, new-logo acquisition, reactivation, and expansion so growth is not treated as a single rate.
- Investigate churn concentration by segment, channel, and tenure before increasing acquisition spend.
- Establish an explicit expansion / upsell driver rather than relying on new logos to replace leakage.
- Use CAC payback thresholds that update as ARPU and retention change; do not freeze an 11-month average as a permanent hurdle.
Selected Visual
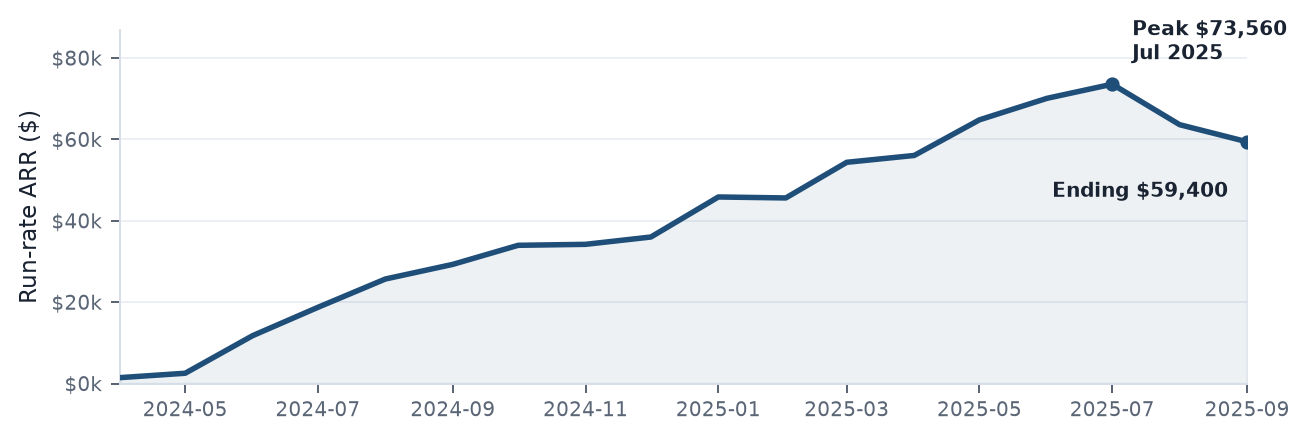
Charts for the ARR bridge, monthly NRR / GRR, active customers, and CAC payback are in the SaaS Growth Economics PDF.
Technical Methodology
Tools used: Python, DuckDB, SQL, pandas, and matplotlib. Assigned customer CAC is used rather than GL marketing-spend allocation. The window is frozen through 2025-09-30. The fixture contains no true upgrade or downgrade activity. The analysis does not make causal inference claims.
GitHub Repository
Methodology and code: github.com/ecastillo081/SaaS-KPI-Dashboard.